Frankencode: Using Python's Seaborn Creature in R
Tagged as: [2 May 2018 – The integration of Python and R has been going on for a while and the benefits tend to increase. Earlier, we took a look at loading Python’s keras package into R. We found the exercise to be worthwhile and the results impressive, but there were some quirks that generally aren’t mentioned in the official documentation. Using Python’s signature libraries – seaborn, matplotlib, and pandas – provide similar benefits and challenges.
Of course, all this is made possible by R’s reticulate package, which enables R and Python to play together. So we start by loading reticulate for the functionality and MASS for the data sets we will use in this simple exercise.
library(reticulate)
library(MASS)
We move next to the Frankencode. I still can’t get used to seeing R code and Python code intermingling on the same line, but I supposed I will have to get used to it.
sns <- import('seaborn')
plt <- import('matplotlib.pyplot')
pd <- import('pandas')
Having gone through difficulties using keras in R, I anticipated problems when working the Python libraries in the R environment. It didn’t take me long to encounter the main problem. When importing the Python libraries, R threw off this mysterious and unhelpful error message:
This application failed to start because R could not find or load the Qt platform plugin “windows” in ‘’. Reinstalling the application may fix this problem.
Much googling and poring through StackOverflow led me to understand that it was a problem with Anaconda3, PyCharm, TexWorks, and MiKTex. A number of solutions were suggested, everything from changing environment variables to removing Qt and PyQt then reinstalling. None of these worked but they pointed me in the right direction.
I decided the best way to start was to reinstall Anaconda3 with the latest version. When I did, I ran Anaconda Navigator and noticed a new program called qtconsole. I found this hopeful so I ran the console, went back to R, and imported the libraries. This time it all worked well.
It turns out I had this problem because I was working in R 3.4.4. Now that I have upgraded to R 3.5.0 I don’t need to run Anaconda3 and qtconsole. The libraries run straight out of R.
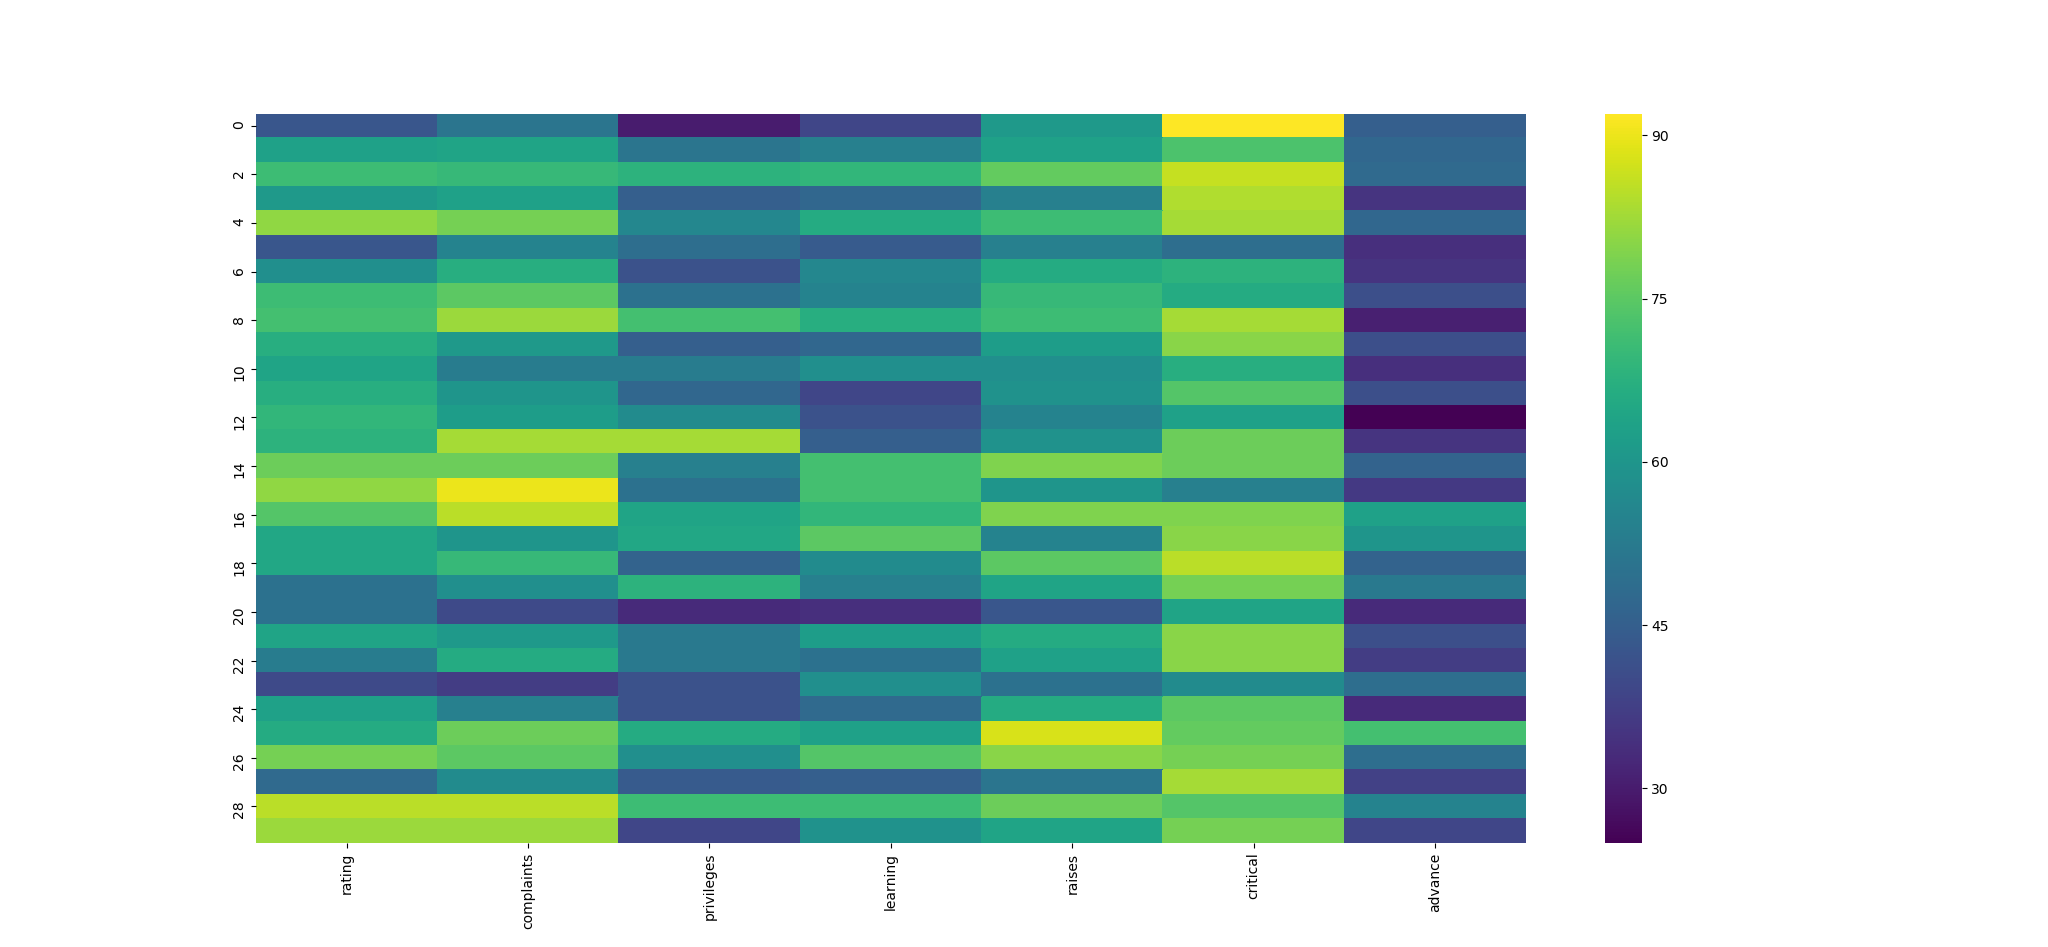
There are a couple data sets in base R that illustrate what these libraries do well, so I created an R object and got back to plugging it into Python. Ther_to_py() function is key to this operation, which creates a heatmap graphic from Seaborn. The results using the attitude data set in Seaborn are pretty impressive. Score one for Python!
df <- attitude
sns$heatmap(r_to_py(df), fmt = "g", cmap = 'viridis')
plt$show()
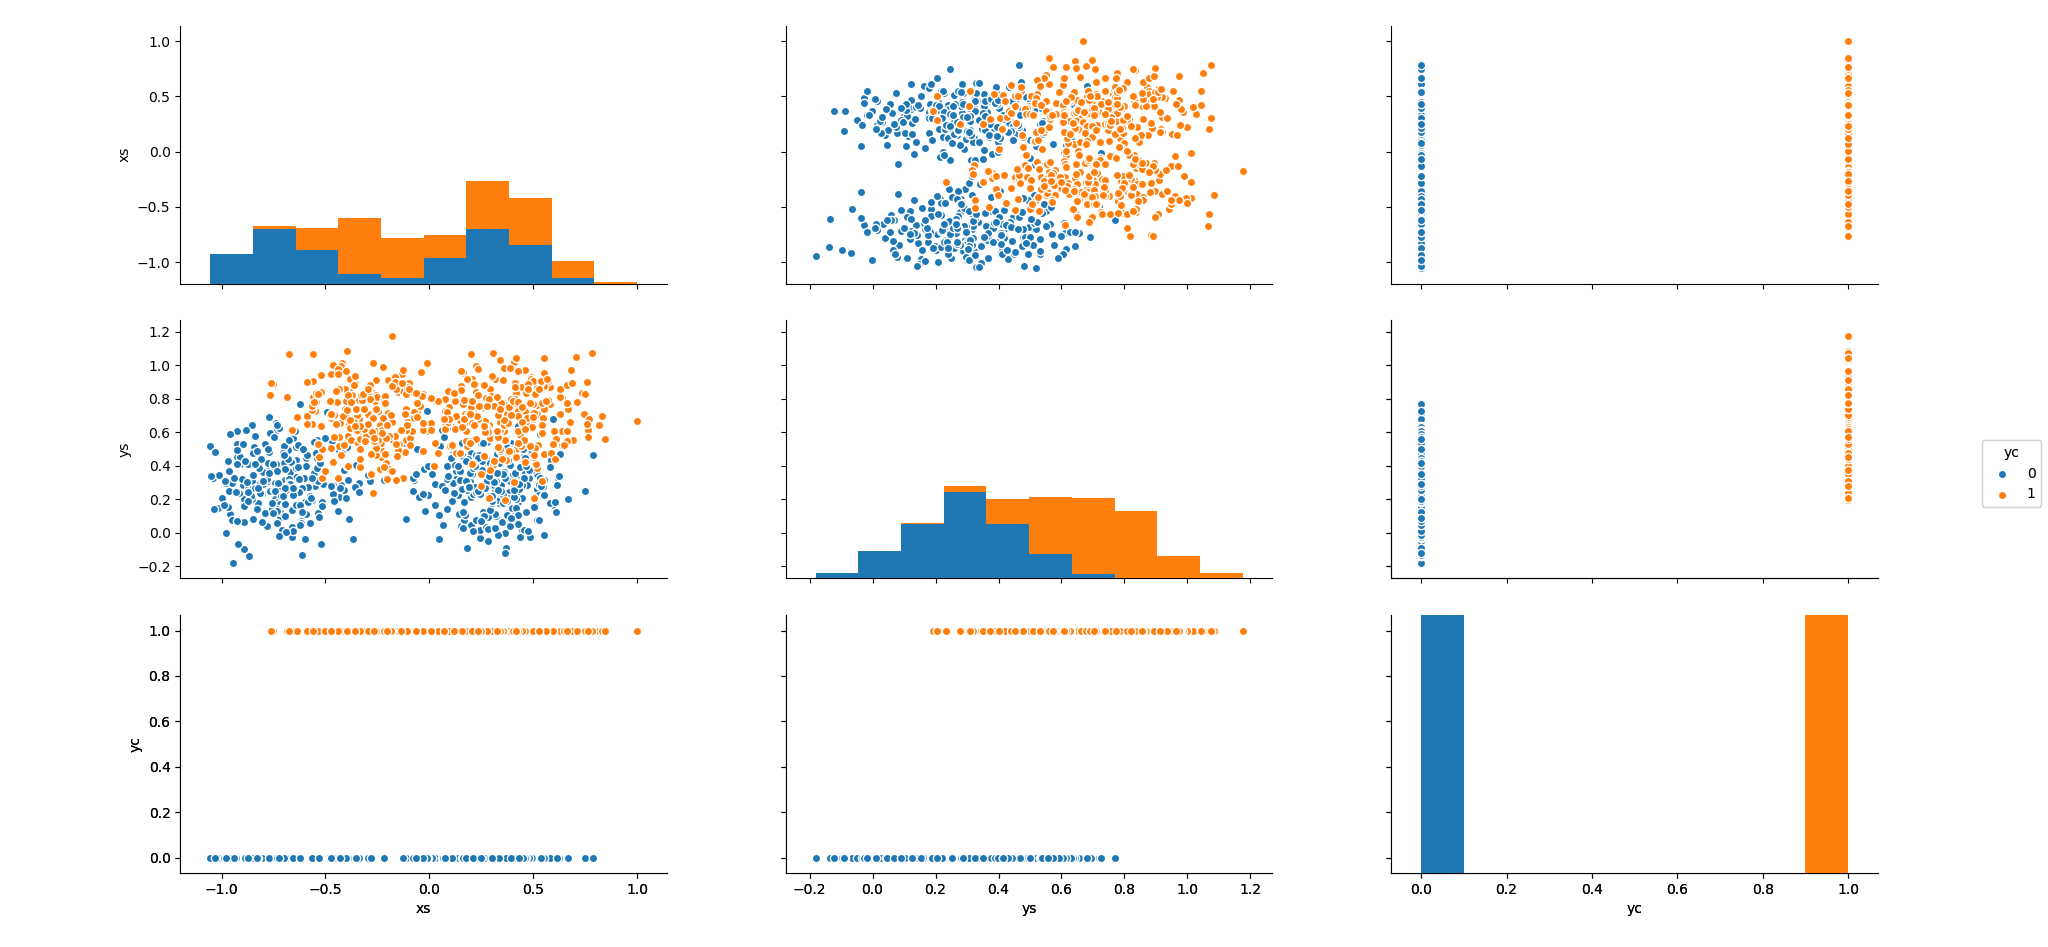
I also wanted to try pairplot() in Seaborn so I worked up an example using the synth.te data set. It is a synthetic data set which I chose because it has a binary categorical coded 0 and 1, so the pairplots worked out nicely.
sns$pairplot(r_to_py(synth.te), hue = 'yc')
plt$show()
Thanks to the datascience+ online community for bringing R and Python together.